
Overview
This is a step-by-step guide to set up your Elemental Machines Insights Dashboard. This article will cover how to set up Alert Rules, User Groups, additional Users, and verify that your lab monitoring system and devices are working correctly. This user guide is intended to be used after the completion of the Gateway Setup (Element-C, D, and Gateway GW2/GW3 Wi-Fi Connection Guide) and Elements Setup (Element-T, A, B, D, C, and U User Manuals).
Section 1: Machines
After you log in, the default home screen will show a left-hand menu of options with the Machines page at the top displaying a list of the pre-installed Elemental Machines devices for your site to the right. If devices are not visible or pre-installed, follow the steps here on how to add devices to your group or watch the following video.
By default, the dashboard is organized by Element type. For example, your Element-T, Element-A, and Gateway devices will be grouped in their own accordions. To change this default view, click the Customize View icon on the right side of the dashboard:

You will then be able to use the toggle switches to organize the Machines page by equipment category or location if desired:

On the Machines page, click on the Element type accordion to expand it and see each Element's details. The real-time status of each Element and Gateway can be found next to the machine name.
- Battery status – For battery powered Elements (i.e., Element-T, Element-A, Element-B, and Element-U), you can view battery level percentage by hovering over the battery icon with your mouse. We suggest changing the batteries when it is below 10%. The system can be configured to alert users automatically when the battery percentage falls below 10%.
- Connection status – For battery powered elements, hover over to the signal strength icon to see the RSSI for a particular device to the nearest gateway. Any device with an RSSI of less than -85dBm is likely to experience intermittent drops in connection. For Gateways, the connection status icon will indicate the method of connection (Wi-Fi, ethernet, or cell).
- Last Updated – This column shows the last time since each device successful sent data to the dashboard. This will typically show last updated within 1 minute if working properly.
- Data Values – Each machine will provide a real-time discrete data measurement.

Element-T Real-Time Status

Element-A Real-Time Status
Section 2. Machine Details
After clicking on the name of a specific Element on the Machines page, the dashboard will update displaying the Machine Details, the Alert Rules being applied to this Machine, and a graph of Machine's data collected over the last 36 hours.

The Machine Details, displayed to the top left of this landing page provides a summary of the device tags. To edit these tags, Admins and Managers can click the Edit Machine Details icon in the right corner of this section (circled below) to make the necessary updates. To the right of the Machine Details section, the Alert Rules section displays the alert rule that are applied to the device.

To change the timescale of the displayed data, users can click the dropdown arrow on the time window (circled below) to select the beginning and ending dates. The graph will automatically adjust, and the x-axis date range will change on the chart. The user can also click last day, last week, last month which will automatically update the date range.

The user can click, drag, and release on sections of the graph to zoom in or to reach individual data points. The Reset Zoom button will revert back to the date range originally selected.
Data Logbook – this tab allows you to see the individual data logs collected every 15 seconds (by default) with the timestamps on the left and data on the right. This data can be easily exported as a CSV file. The default sample rate setting for the data logbook can be changed based on the options found in the Sample Rate drop-down.

The Alert Events, Notes, and Change Log tabs are also selectable above the graph. These will show any triggered alert events, notes added to the machine graph, and an audit trail of changes made to the machine details of the selected device.
Section 3. Alerts
The Alert Rules in the EM dashboard must be configured by the users of the system. Admins, Managers, and Users all have the capability to create Alert Rules. The system offers four types of alerts: Threshold, Connection, Power, and Error. Once the Alert Rule are created, their status can be assessed at a quick glance on the machine page by the Alert Tiles.

The Alert Tiles are located at the top of the Machines page, providing a fast, easy, and highly visual way to check your system's health. The Alert Tiles are color coded to denote the status of the alert, black for inactive alerts, red for active alerts, and yellow for paused devices.
The number on each tile shows the number of active alerts of a particular category. Clicking on the Alert Tile will take you to the Active Alerts section of the dashboard. If the user does not want to see the Alert Tiles displayed, the Alert Tiles can be disabled in the Customize View page (see Step 1).
Hovering over Alerts on the left-hand menu will display three options: Active Alerts, Alert Rules, and Alert History. Each section will be covered below. If you are setting up Alert Rules for the first time, please skip Active Alerts and go to Alert Rules.

Active Alerts
The Active Alerts section will show any device that is currently in an alert state. Active alerts can be claimed and commented on by a recipient of the alert notification to notify other team members of any actions taken to resolve the issue. To display the details of an alert event click the arrow on the left side the alert to see the time stamps, notifications, and messages in chronological order.

Active Alerts - Claiming: Claiming an active alert will prevent other recipients on the Alert Rule from receiving further alert notifications until the alert event is resolved. All of the users who have been notified of the alert event, will receive a message informing them that the alert has been claimed, registering the name of who claimed it and the time stamp. The Alert History and Active Alerts screens will indicate that the alert was claimed in the Activity column.

Active Alerts - Comment: Causes and corrective actions can be listed in a comment on an alert event. Comments will be indicated in the Activity column of the alert event and will be displayed in the logs of the alert event.

Active Alert - Details: Clicking on details for an Active Alert will display the alert history of the machine in chronological order.

Active Alerts Summary
Note: Only Administrators or the Alert Rule creator can perform changes on existing Alert Rules. Managers or Users of the system may be able to edit an existing Alert rule if the “Sharing Option” toggle is enabled for a given Alert Rule.
Alert Rules
The second selectable option under Alerts is Alert Rules. Clicking on Alert Rules allow users to add, edit, and view Alert Rules for the group. Follow the steps below to set up new Alert Rules.
Create New Alert Rule by clicking the + New Alert Rule button on the top ride right side of the window:

After clicking the + New Alert Rule button, the New Alert Rule screen will update, and you will be able to input a name for the Alert Rule and select the alert type. The alert types are described below:
- Threshold – This type of alert is used to set a maximum and minimum range of a given data parameter (e.g. temperature) and the time duration you will allow the value to be out of range before a notification is sent out. You can also create a threshold alert to notify you when an Element-B detects an alarm state.
- Connection – This type of alert is used to notify you if the Bluetooth connectivity of Element-A's, B's, T's, or U's has been lost or if Wi-Fi, ethernet, or cellular connectivity has been lost on Gateways, Element-C's, or D's.
- Power – This type of alert is used to identify if the battery percentage of Element-A's, B's, T's, or U's is below 10%, or if the Gateway has been disconnected from power and is on battery backup.
- Error – This type of alert is used to identify if the thermocouple connected to Element-T's has been disconnected from the Element or if the thermocouple has been damaged.

Once you have named the Alert Rule and the alert type is selected, the page will update and you will be able to configure the following Alert Rule settings:
- Select the Machine Type(s) that apply to this alert rule.
- Filter machines by category, location, and/or custom tags. If necessary, click advanced options, check the "Assign this rule only to specified machines" box, and choose the individual devices you want to apply the rule to.
- Set the minimum, maximum, and notification delay (i.e., the time outside of the thresholds before the alert notification is triggered) per your organization's alert SOPs. Note: Individual parameters will vary based on the type of equipment that the Element is monitoring. For example, the high/low threshold for a -80C freezer should differ from those for a +4C Fridge.
- Schedule – Set the alert to trigger any time of day or between a specific time period, such as 9 AM to 5 PM Monday through Friday.
- Delivery Method – The cadence of the notifications and the method of communicating alert notifications can be set up here. The system offers four methods of notification: email, SMS text message, mobile app push notification, and phone call. Note: ensure the recipients of the Alert Rule have added a mobile number to their account profile to receive voice calls and SMS text messages.
- Recipients - Select one or more recipients and confirm their user role and contact information. You can also add in additional email recipients for shared email accounts or team members who do not have EM dashboard accounts.
- Escalation (optional) - Click the + button to add a new escalation level. Escalation levels can go to different recipients and can involve different notification types. For example, initial notifications are sent via email and escalation notifications are sent via SMS or voice calls.
- Sharing Options: The “Allow Edit” toggle will allow Managers and Users who have been added to the Alert rule's recipient section to edit the rule and affect all other users' alerts. If this is not set, only the Alert Rule creator and other Admins in your customer group can change the alert.
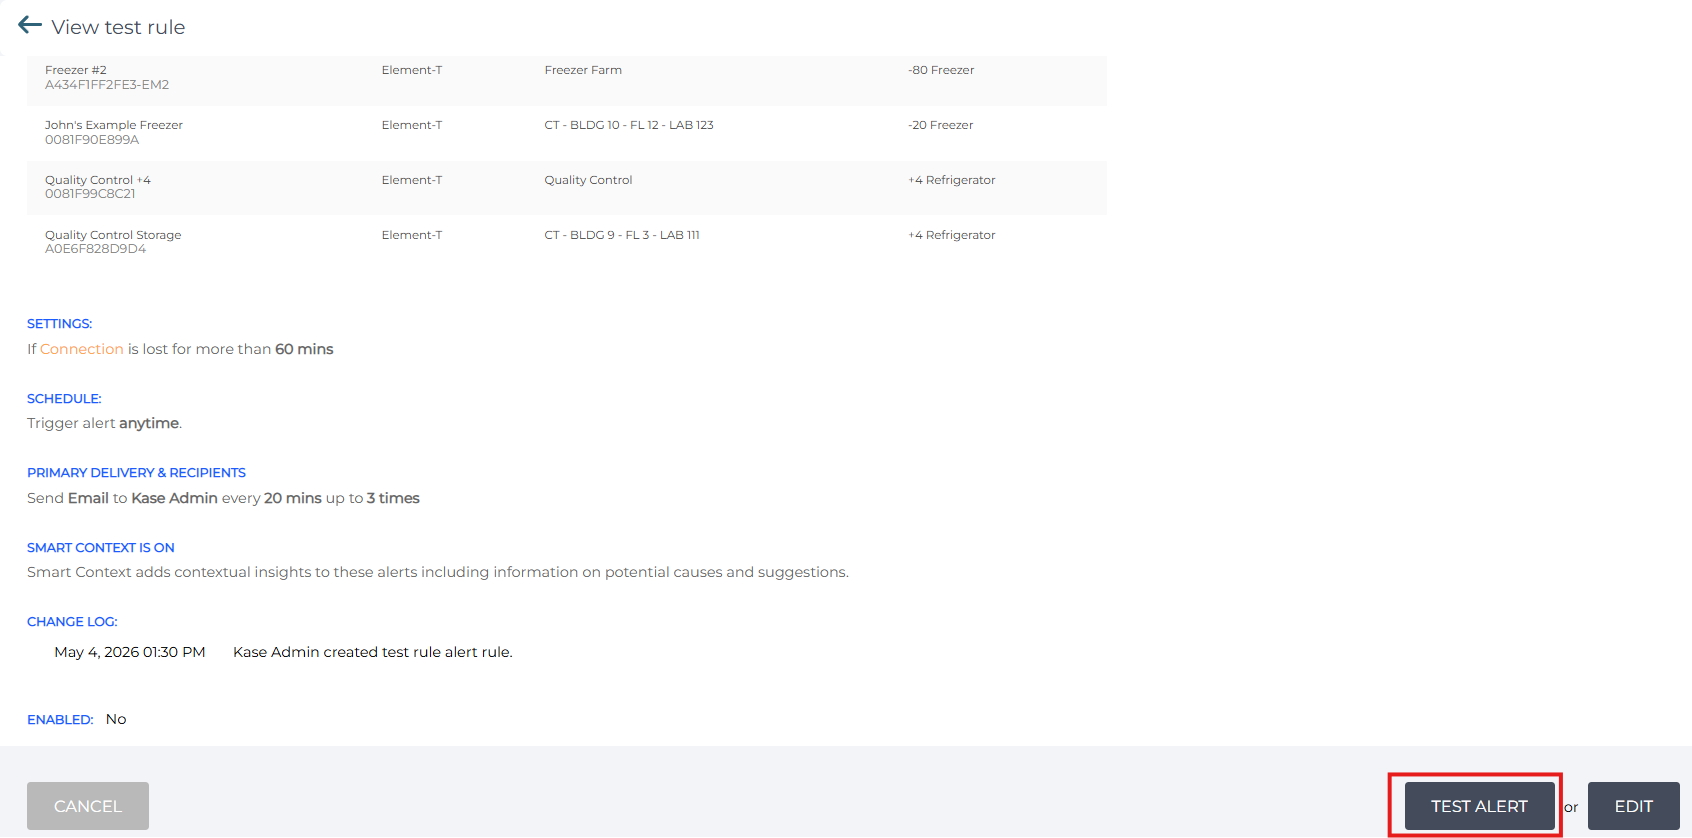
Once all of the Alert Rule settings are configured, scroll to the bottom of the page and click Save. Alert notification delivery can be tested using the "Test Alert" button under View Alert, which will send out a test notifications to all recipients, including escalating alerts via the delivery methods selected.
After an Alert Rule is created, it will be displayed on the main Alert Rules page. From this page, the alert can be easily enabled or disabled with the toggle switch on the right.

Under the "Actions" column each alert can be easily viewed, duplicated, edited, or deleted.

Alert History
Alert History is the third selectable option under Alerts menu and it shows the history of alert events for all machines within the group in chronological order. The page defaults to show all types alerts but the history of each alert type can be viewed by selecting the appropriate tab at the top. Additionally, you can export a log of the alert history to a CSV file with the Export Log button at the top right of the page.

For more information on how to use Alerts effectively, please use the following articles:
- Alerts Best Practices
- Escalating Alerts User Guide
- User Groups as Alert Recipients
- Setting Up Alert Rules During and Outside Business Hours
- Example Threshold Alert Rules for Typical Lab Equipment
Section 4. Usage
The Usage page empowers your organization to monitor real-time and historical usage to guide the service, relocation, removal, and purchase of lab equipment to optimize capital and operating resources. Element-U's can be used to monitor lab equipment utilization by leveraging machine learning algorithms to determine and archive if the machine is in an ON, OFF, or IDLE state. This data is available to view through the Usage page. This option may be grayed out if you have not purchased Element-U's or the feature has not been enabled for a particular subgroup.
To learn more about Usage, please refer to the Element-U Data Sheet, the Element-U User Manual, or reach out to the Customer Success Team at CSM@elementalmachines.com to discuss your options.
Section 5. Open Door
The Open Door page is a unique feature within the EM Dashboard that calculates how many times a freezer, refrigerator, or incubator is opened in a given time period using Element-T data. Open-door data is available for devices with the default -80C, -40C, and -20C freezer, +4C refrigerator, and incubator equipment type tag. Note that this feature will only work for units that are tagged using the previously mentioned "System Categories", but will not work for devices tagged with a "Customer Category". If this feature is not enabled for your organization, please get in touch with the Customer Success Team at CSM@elementalmachines.com to discuss your options.
Section 6. Calibration
The Elemental Dashboard allows for the verification and adjustment of the slope and offset parameters for Element-T and Element-A temperature data through the Calibration menu. To learn more, please see the Calibration User Guide. If this feature is not enabled for your organization, please get in touch with the Customer Success Team at CSM@elementalmachines.com to discuss your options.
Section 7. Calendar
The Elemental Machines Calendar is a lab equipment reservation software that allows you to reserve assets, assign users, and tag protocols for any tool across the lab. Please review the How to Access and Navigate the Calendar Application article to learn more about the Elemental Machines Calendar. If this feature is not enabled for your organization, please get in touch with the Customer Success Team at CSM@elementalmachines.com to discuss your options.
Section 8. Reports
Reports are a core capability of the Elemental Machines platform that facilitates the generating of data history and alert history reports for individual machines or for a group of machines covered by the same alert rule. Reports can be generated on-demand or can be configured to run on a set schedule (e.g. daily, weekly, or monthly), delivered via email.
The reports can be easily set up on the Reports page by clicking + New Report:

The screenshot below shows how users can set up a monthly report for either a single -80C freezer by selecting the Data History option or for all -80C freezers under a single alert rule by selecting the Alerts option.

The user can customize what information is included in the report. In the screenshot below, the user has chosen graphs, data logs, and alerts.

Similarly, alerts reports can be easily customized by toggling on and off the selected data options. The alerts report below will include the data logs and alerts details for any alert event that occurs within the past month.

Once each parameter is set up (i.e., sample data – every 1 hour, time frequency - monthly, and the email recipients are designated), the report can be saved. Scheduled reports will be delivered via email; past scheduled reports can be accessed in the "Reports" tab on the Reports page. On-demand reports are generated after clicking "Run Now"; the report can be saved locally by downloading the PDF version of the report.
Section 9. Order More Elements
The Order More Elements option links to a form on the EM website where you can fill out the necessary details to order more Element-T's and Element-A's. This option should only be used for ordering new devices, not replacements. If you need to order replacement devices, please submit a support ticket or email help@elementalmachines.com. If this option is not available in your dashboard please please get in touch with our Customer Success Team at CSM@elementalmachines.com to discuss your options.
Section 10. Admin
The Admin page is available to Admins and Managers only. In the Admin page you perform the following functions:
- Adding, deleting, and renaming subgroups - to navigate through your organization's dashboard, click the dropdown menu at the top of the screen, then click on the subgroup you would like to edit. When you have chosen a subgroup, you can then add a subgroup beneath it, delete the subgroup, or change the display name of the subgroup.
- For example: you may want to separate R&D devices from devices in a GMP or regulated environment. Regulated devices may have different Alert Rules, reports, and scrutiny that justifies separating them from other sets of Elements.
- Adding, removing, and editing machines - clicking on the Machines tab will allow you to make changes to the devices that are in the subgroup
- Managing your gateways - The Gateways tab shows all your gateway devices in the subgroup and the connection method they are currently using. Managers and Admins can also use the 'Edit Wi-Fi' function to add gateways to a Wi-Fi network during initial setup or to change the network they are connected to.
- Adding, removing, and editing users - The Users tab allows you to add an existing user to a subgroup, create a new user, or edit an existing user. The user settings, such as name, email address, phone number, roles, password, and customer groups, can be selected here. User accounts can also be locked out of the dashboard or disabled (meaning they will no longer receive notifications).
- To create a new user, click the + icon to create a new user on the right. Fill in the required fields: First Name, Last Name, Email, and Role. Note: when creating a new account, it is also recommended to add the account to the necessary subgroup(s).
Accounts can have the following three roles from the lowest to highest privileges:
- Viewer: This role allows a user to log into dashboard and view all available sections but are not able to create or edit any elements like Alert Rules or Reports. A Viewer Role user does have the ability to make adjustments to person view settings on the Machines page.
- User: Can view reports, machine details, claim/comment on alert notifications, and set alerts for themselves in the customer group they belong to. Users can view the Utilization and Calendar features. Users are unable to change machine details or edit Alert Rules created by others unless they are a recipient of that alert rule and sharing is enabled.
- Manager: Can create new users and groups below the current group level and can add/remove devices from their subgroup(s). Managers can edit machine details and Alert Rules within the subgroups they are assigned to. Managers can access Utilization and Calendar Features.
- Admin: Admins have the same permissions as Manager; however, they can make changes across your entire organization instead of just the groups they are assigned to. Admins are also able to access additional features such as Calibration, Calendar, and Utilization.
Note: When a new user is created, a welcome email will be sent with a link to set up their account.
Section 11. Support

The Support menu has three options to select from:
- Help – navigates to the Elemental Machines Helpdesk. Here you can submit a support ticket or browse the articles, videos, and documents in our knowledge base. The knowledge base includes articles, datasheets, user guides, installation instructions, and short videos to help you get the most out of your products.
- Release Notes – provides a historical summary of software updates made to the dashboard.
- System Status – shows the stability and current status of the Elemental Machines Dashboard and services. All outages will be tracked here with explanations in the log. Users can subscribe to email updates on this page as well.
Section 12. Account

The Account menu is available to all users and provides the following three options:
- User Settings – edit Display Name, Email, and Phone number for SMS text message and voice call alerts. Users can also choose to opt out of certain features and communication.
- Preferences – used to set up local time and date format.
- Change Password – allows Users to change their password if necessary.